Why the rupee is falling: a 10-year data study as the RBI curbs dollar demand
By Shamyak
Published
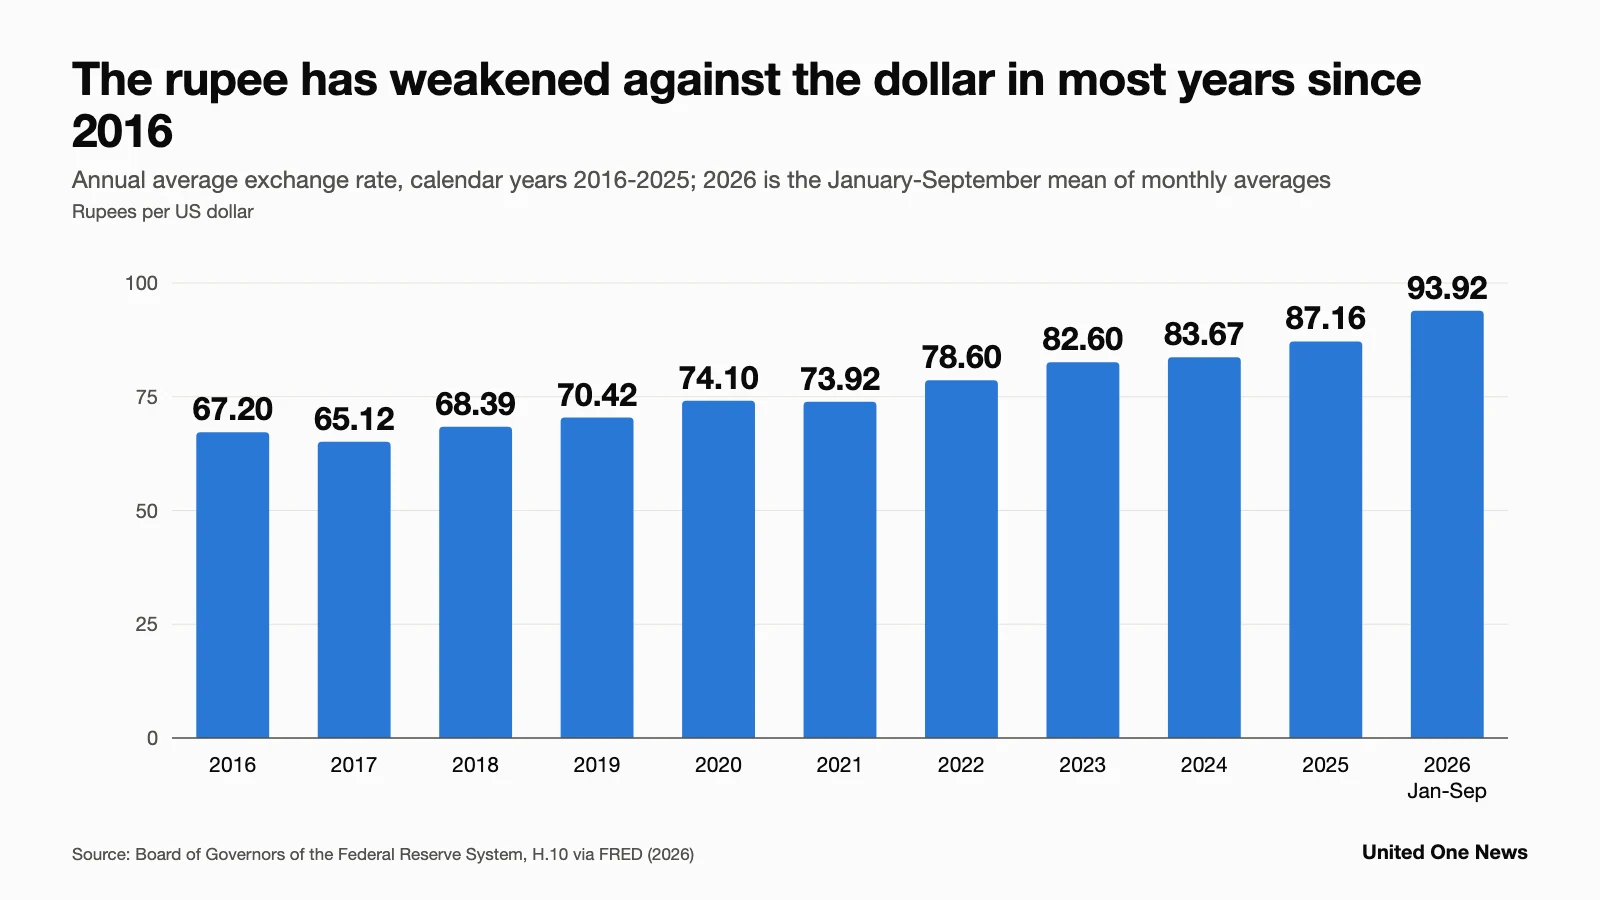
The rupee hit a record 96.96 per dollar in May and traded at 94.96 on 13 October. Ten years of data point to dear oil, foreign selling and a record trade gap, and we track what the RBI and government have done.
Original report
Data as of 13 October 2026, 16:30 IST. This article is for information only and is not investment advice. Readers should consult a registered adviser before investing.
The rupee is falling because oil above US$100 a barrel, heavy foreign selling of Indian shares and a record trade gap have pushed up demand for dollars faster than India earns them. On 13 October 2026 it traded at 94.96 per US dollar in early deals, Deccan Chronicle reported, after a record low of 96.96 in May (Press Trust of India, 2026b; Business Today, 2026b).
This is a research paper, not a market report. We built a 10-year dataset, 2016 to 2026, from the World Bank, the US Federal Reserve and the US Energy Information Administration. We then set it against what the Reserve Bank of India (RBI) and the government have done this year, and used it to answer the 10 questions readers search most.
Abstract: three numbers explain the 2026 slide
The study comes down to three figures, each from a named source.
- 5.7%: how much weaker the rupee was on 13 October 2026 (94.96) than at the end of 2025 (89.84), from Federal Reserve data and Deccan Chronicle's report (Board of Governors of the Federal Reserve System, 2026; Press Trust of India, 2026b).
- US$308.2bn: India's merchandise trade deficit in 2025, about 3.2 times the US$97.1bn of 2016, derived from World Bank import and export data (World Bank, 2026).
- About US$51bn: the fall in forex reserves between a record US$785.71bn on 4 September 2026 and US$734.6bn on 2 October, Trading Economics reported (Trading Economics, 2026).
Our main finding is that the rupee's worst years share a pattern: a wide current account deficit, foreign money leaving and expensive oil. 2026 has all three at once. The next section shows the pattern year by year.
The 10-year record: the rupee weakened in eight of the last nine years
Over the decade, it took 29.7% more rupees to buy a dollar on average in 2025 (87.16) than in 2016 (67.20), according to the Federal Reserve's H.10 series (Board of Governors of the Federal Reserve System, 2026). The fall was uneven. It came in jolts, not a steady drift.
All years below are calendar years. The average is the mean of the year's exchange rates; year-end is the last reading of the year.
USD/INR, annual average (rupees per US dollar, calendar year)
- 2016: 67.20
- 2017: 65.12
- 2018: 68.39
- 2019: 70.42
- 2020: 74.10
- 2021: 73.92
- 2022: 78.60
- 2023: 82.60
- 2024: 83.67
- 2025: 87.16
- 2026: about 93.9 (mean of January to September monthly averages)
USD/INR, year-end (rupees per US dollar, calendar year)
- 2016: 67.92
- 2017: 63.83
- 2018: 69.58
- 2019: 71.36
- 2020: 73.01
- 2021: 74.39
- 2022: 82.72
- 2023: 83.19
- 2024: 85.55
- 2025: 89.84
- 2026: 94.96 (13 October, not a year-end figure)
On our arithmetic from the year-end figures, the rupee weakened in every year from 2018 to 2025. Its two worst years were 2022 (11.2% weaker) and 2018 (9.0% weaker). Only 2017 went the other way, when it strengthened by 6.0%.
Inside 2026, the Federal Reserve's monthly averages show the slide clearly: 90.90 in January, 93.48 in April, 95.53 in May and 95.51 in September (Board of Governors of the Federal Reserve System, 2026). Those two bad years, 2018 and 2022, are the key to the rest of this paper. The forces behind them come from both outside and inside India.
External factors: oil, foreign selling and a narrowing rate gap
The outside world explains most of the rupee's worst years. Three forces stand out in the data: crude prices, foreign portfolio money and US interest rates.
Brent crude, annual average (US$ per barrel, calendar year)
- 2016: 45.08
- 2017: 54.89
- 2018: 71.61
- 2019: 64.20
- 2020: 43.33
- 2021: 70.83
- 2022: 98.99
- 2023: 82.32
- 2024: 79.91
- 2025: 68.32
- 2026: 105.47 (spot price on 13 October, not an average)
Oil matters because India pays for crude in dollars. Brent averaged US$98.99 in 2022, the highest of the decade, in the rupee's worst year (U.S. Energy Information Administration, 2026). In 2026 the shock was sharper. Outlook Money reported that the US-Israel-Iran conflict from late February sent Brent up 40% by 1 April (Outlook Money, 2026). Brent was US$109.97 on 18 May and US$105.47 on 13 October (Press Trust of India, 2026a; Press Trust of India, 2026b).
Net portfolio equity inflow (US$bn, World Bank balance-of-payments data, calendar year)
- 2016: 2.3
- 2017: 5.9
- 2018: -4.4
- 2019: 13.8
- 2020: 24.9
- 2021: 5.2
- 2022: -16.6
- 2023: 21.4
- 2024: -0.8
- 2025: -18.5
- 2026: not available in US dollars
Foreign money left in both bad years: US$4.4bn net in 2018 and US$16.6bn in 2022 (World Bank, 2026). The 2025 outflow of US$18.5bn was the largest of the decade. In 2026, Angel One reported NSDL data showing foreign investors sold Rs 2.85 lakh crore of Indian shares up to 11 June (Angel One, 2026). They were net sellers every month except February, with March the worst at Rs 1.18 lakh crore. The selling had not stopped by October: foreign institutions sold Rs 1,708.48 crore of shares on 12 October, Deccan Chronicle reported (Press Trust of India, 2026b).
US interest rates are the third force. Drishti IAS listed a narrowing India-US interest rate gap among the reasons the RBI raised rates in October (Drishti IAS, 2026). A smaller gap makes rupee assets less rewarding for foreign investors than before. The fact pack has no US rate figures, so we cannot measure the gap itself.
Trade with the rest of the world is the last external pressure, and it is also India's biggest internal weakness.
Internal factors: a trade gap three times its 2016 size
India's own balance sheet has made the rupee more exposed. The merchandise trade deficit has more than tripled in a decade, while inflation and the current account have swung less.
Merchandise trade deficit (US$bn, World Bank imports minus exports, calendar year)
- 2016: 97.1
- 2017: 150.7
- 2018: 189.7
- 2019: 161.7
- 2020: 96.8
- 2021: 177.7
- 2022: 267.0
- 2023: 242.4
- 2024: 275.4
- 2025: 308.2
- 2026: not available (April alone was US$28.4bn)
Current account balance (% of GDP, calendar year; minus is a deficit)
- 2016: -0.53
- 2017: -1.44
- 2018: -2.43
- 2019: -1.05
- 2020: 1.22
- 2021: -1.06
- 2022: -2.43
- 2023: -0.91
- 2024: -0.85
- 2025: -0.51
- 2026: not available
The two worst rupee years had the same current account deficit, 2.43% of GDP, the widest in the series (World Bank, 2026). The one surplus year, 2020, had large foreign inflows of US$24.9bn and the rupee weakened by only 2.3% on our arithmetic. A trade deficit means India buys more goods abroad than it sells, so it needs more dollars than its exporters earn.
In 2025 the trade deficit hit a record US$308.2bn, yet the current account deficit was only 0.51% of GDP. Other earnings, such as services, covered much of the goods gap. That year the rupee still lost 5.0%, as foreign equity money left. In April 2026 alone, the trade deficit was US$28.4bn, Deccan Chronicle reported (Press Trust of India, 2026a). Figures for September 2026 conflict across sources, so we have left them out.
Growth is the one internal number moving the right way. The RBI raised its growth forecast for 2026-27 from 6.7% to 7.1%, Drishti IAS reported (Drishti IAS, 2026). Strong growth can also raise imports, which keeps dollar demand high. That leaves the question of how the authorities have responded.
What the RBI and the government are doing now
The RBI has moved on three fronts in 2026: selling dollars, raising rates and restricting speculation. The government has raised the cost of gold imports.
Dated measures, from the sources we read:
- March 2026: the RBI capped banks' net open forward rupee positions at US$100m. Reserves fell below US$700bn after US$11bn was lost in the week to 20 March (Outlook Money, 2026).
- 13 May 2026: the government raised the effective import duty on gold from 6% to 15%. Business Today reported the World Gold Council's estimate that this could cut demand by 50 to 60 tonnes, about 10% (Business Today, 2026a).
- September to October 2026: the RBI sold dollars and ran sell/buy swaps as reserves fell for four weeks in a row, to US$734.6bn on 2 October (Trading Economics, 2026; Business Today, 2026b).
- October 2026: the Monetary Policy Committee raised the repo rate by 25 basis points to 5.50%, its first rise since February 2023. The standing deposit facility is now 5.25% and the marginal standing facility 5.75%, and the stance is "calibrated tightening" (Drishti IAS, 2026).
- From Monday 12 October 2026: five curbs on dollar demand took effect (Business Today, 2026b; Press Trust of India, 2026b).
The five curbs from 12 October are:
- the RBI supplies dollars directly to the oil companies IOC, BPCL and HPCL, so their dollar buying stays off the open market;
- firms can no longer cancel and rebook forex derivative contracts;
- the limit on exchange-traded currency derivatives falls from US$100m to US$5m;
- contracts above US$2m need a 20% cash Foreign Exchange Risk Reserve;
- dealers must check that clients are not hedging the same exposure twice.
The RBI is also trying to pull dollars in. MarketScreener reported that an FCNR(B) swap window is open until 16 October 2026 for deposits raised by 30 September, with a one-year lock-in. An external commercial borrowing facility is open until 15 January 2027, and leverage is allowed on NRI deposits (MarketScreener, 2026).
The rupee rose once the curbs took effect, and Deccan Chronicle credited the RBI's measures. It gained 93 paise on 12 October, its steepest one-day rise in more than six months, and another 82 paise early on 13 October, Deccan Chronicle reported (Press Trust of India, 2026b). It had closed at 96.73 on 10 October (Business Today, 2026b). Amit Pabari of CR Forex Advisors told the paper: "With RBI's measures supporting rupee, we expect USD/INR towards 95.00–94.80."
Raising rates to defend a currency has a second purpose. It also fights inflation, and the rupee and inflation are linked.
The rupee-inflation link is real, but oil decides its size
A weaker rupee raises the price of everything India imports, from fuel to electronics. Ponmudi R of Enrich Money put it in May: "A weak rupee silently acts like inflation" (Press Trust of India, 2026a).
CPI inflation (% a year, World Bank, calendar year)
- 2016: 4.95
- 2017: 3.33
- 2018: 3.94
- 2019: 3.73
- 2020: 6.62
- 2021: 5.13
- 2022: 6.70
- 2023: 5.65
- 2024: 4.95
- 2025: 2.40
- 2026: 5.54 (September only, year on year)
The decade's data shows the link is not automatic. Inflation peaked at 6.70% in 2022, when the rupee fell 11.2% and Brent averaged US$98.99. In 2025 the rupee fell 5.0%, but inflation was 2.40%, the lowest of the decade, while Brent averaged only US$68.32 (World Bank, 2026; U.S. Energy Information Administration, 2026). A weak rupee hurts most when oil is dear at the same time.
That is the 2026 picture. CPI inflation rose to 5.54% in September from 4.83% in August, Deccan Chronicle reported (Press Trust of India, 2026b). Wholesale inflation was 8.3% year on year, the paper reported on 18 May (Press Trust of India, 2026a). The RBI raised its 2026-27 CPI forecast by 20 basis points to 5.2%, citing broad price pressures, a monsoon deficit and crude above US$100 (Drishti IAS, 2026).
Those price pressures land on household and company budgets.
What it means for households and businesses
For households, the costs arrive through fuel, gold and imported goods. For businesses, they arrive through import bills, dollar debts and tighter hedging rules.
- Fuel: oil companies buy crude in dollars. The RBI's new dollar window for IOC, BPCL and HPCL is meant to stop their purchases from pushing the rupee down further (Business Today, 2026b).
- Gold: the duty rise to 15% in May makes gold dearer at home, on top of a weaker rupee (Business Today, 2026a).
- Loans: the RBI's policy rate, the repo rate, is now 5.50%, up 25 basis points and the first rise since February 2023 (Drishti IAS, 2026).
- Prices: inflation of 5.54% in September is above the RBI's own 5.2% forecast for the year (Press Trust of India, 2026b; Drishti IAS, 2026).
- Students and travellers abroad: a dollar cost 94.96 rupees on 13 October against 89.84 at the end of 2025, so the same dollar bill costs about 5.7% more (Board of Governors of the Federal Reserve System, 2026; Press Trust of India, 2026b).
- NRIs: the FCNR(B) swap window, open to 16 October, gives a reason to hold dollar deposits in India (MarketScreener, 2026).
- Importers and exporters: the US$5m cap on exchange-traded currency derivatives and the 20% cash reserve on contracts above US$2m make hedging tighter and dearer (Business Today, 2026b).
Exporters earn more rupees for each dollar of sales, but the sources we read do not measure that gain. Before drawing firm conclusions, it is worth being clear what the data cannot show.
Limitations of the data
This study has gaps, and they shape what it can and cannot prove.
- Calendar, not fiscal, years. Every series is by calendar year. The RBI and the government often report by fiscal year (April to March), so totals will not match official annual reports.
- 2026 is partial. The 2026 exchange rate is a January to September mean of monthly averages. The 2026 Brent figure is a spot price on one day, and the 2026 CPI figure is one month.
- Derived trade deficit. We worked out the trade deficit as World Bank merchandise imports minus exports. It is not an official trade ministry number.
- Portfolio flows. The equity series is World Bank balance-of-payments net inflow, not NSDL FPI data. The two do not match, and 2026 is available only in rupees.
- Not available: the 2026 trade deficit, current account and US$ portfolio totals; the RBI's actual dollar sales; how long the 12 October curbs will last; and US interest rate levels.
- Single sources. The exact date of the October repo decision rests on one source; the Drishti IAS page we read is dated 9 October.
- Correlation, not cause. Bad years share a pattern, but 10 data points cannot prove which factor caused how much of each fall.
With those limits in mind, the evidence still points one way.
Conclusions: the 2026 slide is mostly imported, and its defence is costly
The rupee's fall in 2026 is best explained by forces from outside India that hit an economy already running a record trade gap.
- Pattern: the rupee's worst years, 2018 and 2022, combined a current account deficit of 2.43% of GDP, foreign selling and dearer oil. 2026 shows oil above US$100 and heavy foreign selling again (World Bank, 2026; Angel One, 2026).
- Structure: the trade deficit rose from US$97.1bn in 2016 to US$308.2bn in 2025. That raises India's need for dollars every year (World Bank, 2026).
- Defence: reserves have fallen about US$51bn since 4 September as the RBI sold dollars; it has also raised rates for the first time since 2023 and restricted speculation. The rupee recovered to 94.96 on 13 October (Trading Economics, 2026; Press Trust of India, 2026b).
- Risk: Ahmed Azzam of Equiti Group said on 1 April that "100 per dollar is no longer a tail risk" (Outlook Money, 2026). On our arithmetic, 100 would be 5.3% weaker than 13 October's 94.96.
What happens next: the FCNR(B) swap window closes on 16 October 2026, and the external commercial borrowing facility runs until 15 January 2027 (MarketScreener, 2026). In the near term, CR Forex Advisors expects 95.00 to 94.80 (Press Trust of India, 2026b).
Questions people are asking
Why is the rupee falling against the dollar?
Oil above US$100 a barrel, foreign selling of Rs 2.85 lakh crore of Indian shares up to 11 June 2026, and a narrower India-US interest rate gap (Drishti IAS, 2026; Angel One, 2026). A record trade deficit of US$308.2bn in 2025 adds to dollar demand (World Bank, 2026).
How low has the rupee fallen?
It hit a record low of 96.96 per dollar in May 2026, Business Today reported. It traded at 94.96 on 13 October (Business Today, 2026b; Press Trust of India, 2026b).
What is the RBI doing to stop the fall?
From 12 October 2026 it supplies dollars directly to IOC, BPCL and HPCL, requires a 20% cash reserve on contracts above US$2m, and has cut the exchange-traded derivative limit to US$5m (Business Today, 2026b). It has also sold dollars from reserves.
Did the RBI raise interest rates?
Yes. In October 2026 it raised the repo rate by 25 basis points to 5.50%, its first rise since February 2023 (Drishti IAS, 2026).
Will the rupee hit 100 per dollar?
Nobody can say. Equiti Group's Ahmed Azzam said on 1 April it was no longer a tail risk, but the rupee peaked at 96.96 in May (Outlook Money, 2026; Business Today, 2026b). CR Forex Advisors expects 95.00 to 94.80 in the near term.
More questions people are asking
How much have forex reserves fallen?
From a record US$785.71bn on 4 September 2026 to US$734.6bn on 2 October, a fall of about US$51bn over four weeks (Trading Economics, 2026).
How does a weak rupee affect inflation?
It raises the cost of imported fuel and goods. CPI inflation rose to 5.54% in September 2026 from 4.83% in August (Press Trust of India, 2026b).
Why did gold imports get costlier?
The government raised the effective import duty on gold from 6% to 15% on 13 May 2026, which the World Gold Council estimated could cut demand by 50 to 60 tonnes (Business Today, 2026a).
How does the trade deficit connect to the rupee?
India's merchandise trade deficit grew from US$97.1bn in 2016 to US$308.2bn in 2025, so the country needs more dollars than its exporters earn (World Bank, 2026).
What can NRIs do to help the rupee?
NRIs can use FCNR(B) deposits backed by RBI swap support; the window is open to 16 October 2026 for deposits raised by 30 September, with a one-year lock-in (MarketScreener, 2026).
References
- Angel One (2026) FPIs sell over Rs 60,000 crore of Indian equities in June 2026 so far. Angel One, 11 June. Available at: FPIs sell over Rs 60,000 crore of Indian equities in June 2026 so far (Accessed: 13 October 2026).
- Board of Governors of the Federal Reserve System (2026) H.10 India/U.S. Foreign Exchange Rate (DEXINUS), end-of-period and monthly average. FRED. Available at: H.10 India/U.S. Foreign Exchange Rate (DEXINUS) (Accessed: 13 October 2026).
- Business Today (2026a) India's higher gold import duty could cut demand by up to 60 tonnes in 2026: WGC. Business Today, 1 July. Available at: India's higher gold import duty could cut demand by up to 60 tonnes in 2026: WGC (Accessed: 13 October 2026).
- Business Today (2026b) RBI's rupee defence: special dollar window for oil firms, tighter forex derivative rules. Business Today, 10 October. Available at: RBI's rupee defence: special dollar window for oil firms, tighter forex derivative rules (Accessed: 13 October 2026).
- Drishti IAS (2026) RBI MPC Raises Repo Rate to 5.50%. Drishti IAS, 9 October. Available at: RBI MPC Raises Repo Rate to 5.50% (Accessed: 13 October 2026).
- Khaleej Times (2026) India central bank takes steps to support rupee, opens dollar window for oil companies. Khaleej Times, 10 October. Available at: India central bank takes steps to support rupee, opens dollar window for oil companies (Accessed: 13 October 2026).
- MarketScreener (2026) India's RBI offers concessional swaps, allows leverage for NRI deposits to drive forex inflows. MarketScreener. Available at: India's RBI offers concessional swaps, allows leverage for NRI deposits to drive forex inflows (Accessed: 13 October 2026).
- Outlook Money (2026) Rupee may breach 100 to a dollar by June 2026 if war continues. Outlook Money, 1 April. Available at: Rupee may breach 100 to a dollar by June 2026 if war continues (Accessed: 13 October 2026).
- Press Trust of India (2026a) Rupee hits record low of 96.40 per dollar. Deccan Chronicle, 18 May. Available at: Rupee hits record low of 96.40 per dollar (Accessed: 13 October 2026).
- Press Trust of India (2026b) Rupee Rises 82 Paise To 94.96 Against US Dollar In Early Trade. Deccan Chronicle, 13 October. Available at: Rupee Rises 82 Paise To 94.96 Against US Dollar In Early Trade (Accessed: 13 October 2026).
- Trading Economics (2026) India's FX Reserves Fall for Fourth Week. Trading Economics. Available at: India's FX Reserves Fall for Fourth Week (Accessed: 13 October 2026).
- U.S. Energy Information Administration (2026) Crude Oil Prices: Brent - Europe, annual. FRED, Federal Reserve Bank of St. Louis. Available at: Crude Oil Prices: Brent - Europe (Accessed: 13 October 2026).
- World Bank (2026) World Development Indicators: India (FP.CPI.TOTL.ZG, PA.NUS.FCRF, BN.CAB.XOKA.GD.ZS, FI.RES.TOTL.CD, TM/TX.VAL.MRCH.CD.WT, BX.PEF.TOTL.CD.WD). World Bank. Available at: World Development Indicators: India (Accessed: 13 October 2026).
How we did this
We built the 10-year dataset ourselves from primary statistical series, then checked each 2026 claim against news reports read on 13 October 2026.
- Exchange rates come from the US Federal Reserve's H.10 series via FRED: annual averages and year-end rates for 2016 to 2025, and monthly averages for January to September 2026, which we averaged ourselves.
- Forex reserves, CPI inflation, the current account, merchandise imports and exports, and net portfolio equity inflows come from the World Bank's World Development Indicators. We derived the trade deficit as imports minus exports.
- Brent crude averages come from the US Energy Information Administration via FRED.
- For 2026 we read Deccan Chronicle, Business Today, Drishti IAS, Trading Economics, MarketScreener, Outlook Money, Angel One and Khaleej Times. Khaleej Times dated the curbs to Monday 14 October; 12 October was the Monday, as Business Today reported, so we used 12 October.
- Percentage changes are our own arithmetic on the sourced figures. The 10 questions come from search engines' related queries, not a survey.
This article is for information only and is not investment advice. Readers should consult a registered adviser before investing.
This story was produced, reviewed, edited and verified by the reporter before publication, with AI assistance where required.
Covered by 13 outlets across the spectrum: 0% left, 77% center, 23% right.
Who is covering this story
- Center (5): Angel One, Trading Economics, Business Today, MarketScreener, Outlook Money
- Right-leaning (2): Deccan Chronicle, Khaleej Times
- Not yet rated (3): World Bank, FRED, Drishti IAS
Sources
- Article from World Bank — World Bank (not yet rated) ·
- Rupee Hits Record Low Of 96.40 Per Dollar — Deccan Chronicle (right-leaning) ·
- Article from FRED — FRED (not yet rated) ·
- Article from FRED — FRED (not yet rated) ·
- FPIs Sell Over ₹60,000 Crore Worth Indian Equities in June 2026 So Far; DIIs Remain Net Buyers — Angel One (center) ·
- India’s FX Reserves Fall for Fourth Week — Trading Economics (center) ·
- India's higher gold import duty could cut demand by up to 60 tonnes in 2026: WGC - BusinessToday — Business Today (center) ·
- RBI's rupee defence: Special dollar window for oil firms, tighter forex derivative rules - BusinessToday — Business Today (center) ·
- Rupee Rises 82 Paise To 94.96 Against US Dollar In Early Trade — Deccan Chronicle (right-leaning) ·
- Rbi mpc raises repo rate to — Drishti IAS (not yet rated) ·
- India central bank takes steps to support rupee, opens dollar window for oil companies — Khaleej Times (right-leaning) ·
- India s rbi offers concessional swaps allows leverage for nri deposits to drive forex inflows ce7f5dd3db8af322 — MarketScreener (center) ·
- Rupee May Breach 100 To A Dollar By June 2026 If War Continues - Outlook Money — Outlook Money (center) ·